Most Common Shoe Sizes Per Region: Global Footwear Data

The most common shoe sizes per region cluster around US Men’s 9.5 to 10.5 in Western markets. South Asia averages a smaller US 8 per global demographic surveys. Retailers and collectors who know your audience use these regional benchmarks to match local demand. North America and Europe average a US 10, while Australia averages 10.5 and South America averages 9.5.
- North America & Europe: Average adult male footwear dimension sits at US 10 (EU 44 / UK 9 / 28.0 cm) per international population surveys.
- Australia & Oceania: Ranks highest globally with an average of US 10.5 (EU 44.5 / UK 9.5 / 28.5 cm) across adult men’s runs.
- South America, Africa & Middle East: Clusters around an average of US 9.5 (EU 43 / UK 8.5 / 27.5 cm) in adult men’s footwear.
- India & South Asia: Averages US 8 (EU 41 / UK 7 / 26.0 cm), creating strong regional demand for smaller men’s and grade-school runs.
What Are the Most Common Shoe Sizes Sorted by Region?
Global footwear averages vary by up to 2.5 centimetres across continents. Those differences reflect population height and skeletal proportions. According to World Population Review country footwear rankings, the United States, Canada, and most European nations share a US 10 average. Australia leads global rankings with a 10.5 US average. Meanwhile, India averages an 8 US fit across adult male buyers.
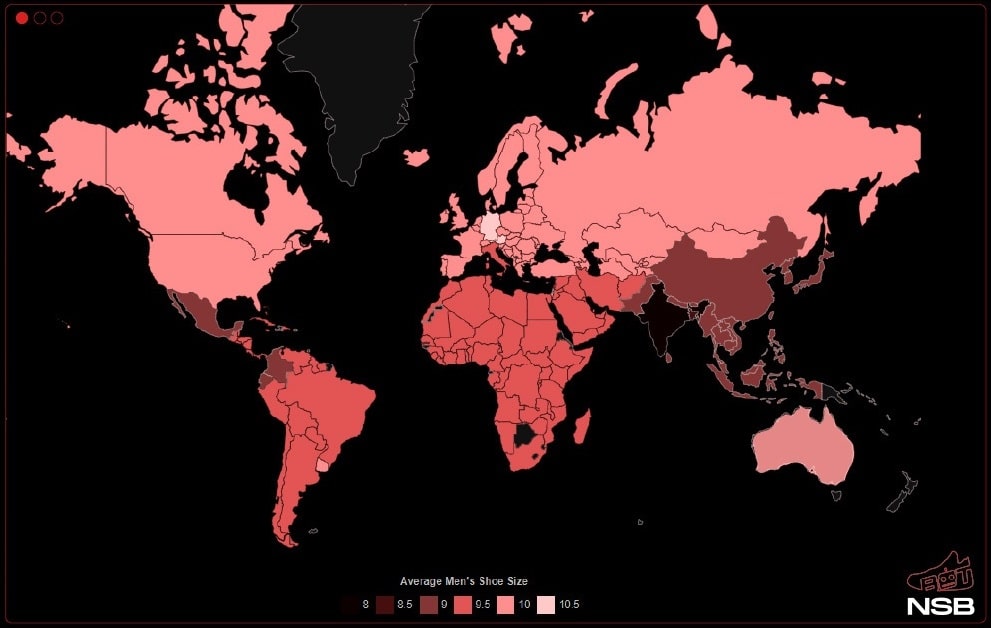
Across South America, Africa, and the Middle East, adult male buyers cluster around a 9.5 US average. In East Asia, retail demand centers between US 8.5 and US 9.5 depending on the country. Shoppers who measure your shoe size in centimetres can compare their exact foot length against these continental averages. That quick check prevents costly sizing mistakes when ordering from overseas boutiques.
| Global Region | Average US Men’s | EU / UK Equivalent | Foot Length & Core Demand Range |
|---|---|---|---|
| US, Canada & Europe | 10.0 US Men’s | EU 44 / UK 9.0 | 28.0 cm; core bell curve spans 9.0 to 11.5 |
| Australia & New Zealand | 10.5 US Men’s | EU 44.5 / UK 9.5 | 28.5 cm; core bell curve spans 9.5 to 12.0 |
| South America, Africa & MENA | 9.5 US Men’s | EU 43 / UK 8.5 | 27.5 cm; core bell curve spans 8.5 to 10.5 |
| India & South Asia | 8.0 US Men’s | EU 41 / UK 7.0 | 26.0 cm; core bell curve spans 7.0 to 9.5 |
Why Does Regional Foot Data Matter for Sneaker Buyers?
Matching footwear inventory to regional demographics determines how quickly deadstock pairs clear on secondary marketplaces. Buyers who buy sneakers in bulk without checking local averages often get stuck holding slow-moving stock. A US 7.5 or US 14 may sit unsold for months in European or North American consignment shops. By contrast, a US 9.5 or 10.5 sells within hours of listing on local marketplaces.
Regional averages also explain why certain territories experience tougher launch-day competition on specific brackets. On Asian SNKRS portals, US 8 through 9.5 allocations sell out fastest during morning draws. Conversely, North American and Australian queues see peak buyer traffic between US 10 and 12. Understanding those geographic patterns helps collectors target the most liquid brackets for their home market.
How Do Factory Production Runs Allocate Inventory Across Tiers?
Footwear manufacturers distribute production volume along a statistical bell curve that mirrors global foot demographics. Per Nike’s global manufacturing disclosure map, over 500 independent contract factories across 41 countries produce athletic footwear. Those facilities use standardized last curves for every release. Across an adult run from US 4 to 18, roughly 55% of pairs fall in the middle per allocation data. That core group spans US 9 through 11.5.

Full-size runs shipped to boutiques in 12-pair or 15-pair master cartons follow this exact bell-curve ratio. A standard 12-pair boutique case typically contains two pairs each of US 9.5, 10, and 10.5. It includes only single pairs of 8, 8.5, 9, 11, 11.5, and 12. Extended brackets like US 13, 14, and 15 account for less than 8% of total factory output per wholesale schedules.
How Do US, UK, EU, and Centimeter Scales Convert?
Ordering from international boutiques requires converting accurately between American, British, European, and Mondopoint centimetre scales. On Nike and Jordan men’s labels, UK numbers sit exactly 1.0 unit below US numbers from US 7 through 12. By contrast, New Balance and Adidas labels use a 0.5-unit offset between US and UK tags. That half-unit difference frequently confuses first-time international buyers.
Collectors who start a sneaker collection rely on the Japanese (JP) or centimetre (CM) measurement. That metric serves as a consistent cross-brand anchor. A 28.0 cm insole mark corresponds to a US 10 on Nike, Jordan, and New Balance boxes alike. Women’s US boxes add 1.5 units to the men’s number. Thus, a US Women’s 10 equals a US Men’s 8.5 (25.5 cm).
| US Men’s | US Women’s | UK / EU Tag (Nike) | Centimeters & Production Share |
|---|---|---|---|
| 8.0 US Men’s | 9.5 US Women’s | UK 7.0 / EU 41.0 | 26.0 cm; ~6% of standard men’s run |
| 9.5 US Men’s | 11.0 US Women’s | UK 8.5 / EU 43.0 | 27.5 cm; ~14% of standard men’s run |
| 10.0 US Men’s | 11.5 US Women’s | UK 9.0 / EU 44.0 | 28.0 cm; ~16% of standard men’s run |
| 10.5 US Men’s | 12.0 US Women’s | UK 9.5 / EU 44.5 | 28.5 cm; ~13% of standard men’s run |
How Do Liquidity and Resale Prices Differ Between Common and Rare Runs?
On secondary platforms, the most common shoe sizes offer the highest daily trade volume. Scarce extreme brackets command higher individual asks. A retro priced at $210 retail might average $280 in US 9.5 to 10.5 with dozens of daily sales per marketplace data. Meanwhile, a scarce US 13 or 14 from the same drop can reach $360 or more because fewer pairs exist.
Core bell-curve brackets between US 9.5 and 11 provide the fastest cash turnover on authentication platforms, while scarce extended brackets above US 12.5 trade at wider price spreads with slower volume.
Sellers evaluating net payouts across brackets must deduct platform commissions from every completed sale. Per StockX’s official seller fee schedule, Level 1 accounts pay a 9% base transaction fee plus a 3% payment processing fee. Those fees leave $246.40 net on a $280 sale. Similarly, GOAT’s seller commission structure deducts a 9.5% base commission. The platform also applies a regional seller fee and a 2.9% cash-out fee.
How Can Collectors Target High-Demand Allocations on Release Day?
Securing liquid US 9.5 to 11 pairs or scarce extended brackets at retail requires setting precise task filters before release morning. Readers studying sneaker botting fundamentals configure their checkout profiles to target specific bell-curve ranges. They avoid leaving size filters set to random leftover brackets. When a boutique loads inventory at 10:00 AM EST, pre-selected range filters prevent tasks from checking out unsellable outlier pairs.
Operators managing multi-store checkouts rely on an all-in-one sneaker bot to monitor regional Shopify, Footsite, and SNKRS stock simultaneously. Experienced buyers compare platforms such as Valor AIO, Cybersole, Stellar AIO, and NikeShoeBot before release day. Those tools let users assign task ratios between core and extended runs. Matching proxy locations and billing profiles to target storefronts ensures smooth task execution during high-traffic drops.
What Is the Average Women’s Footwear Dimension in North America and Europe?
In the United States, Canada, and Western Europe, the average adult women’s footwear dimension sits between US Women’s 8.5 and 9.0 (EU 39 to 40, or 25.0 to 25.5 cm).
What Time of Day Should Buyers Measure Their Feet for Accuracy?
Buyers should measure their feet in the late afternoon or evening while wearing athletic socks, as feet naturally expand by up to half a centimetre after walking all day.