According to Statista’s estimate of global market share in 2022, the most popular sneaker brands were Nike at 18%, Jordan Brand at 11% and adidas at 9%. Statista’s survey of U.S. sneaker owners in spring 2025 reports that Nike was liked by 62%, ahead of New Balance at 45% and adidas at 42%. This list sets the rankings side by side and says what each one measures.
- Global market share, 2022: Nike 18%, Jordan Brand 11%, adidas 9%, according to Statista Market Insights.
- U.S. owners who like the brand, 2025: Nike 62%, New Balance 45%, adidas 42%, according to Statista Consumer Insights.
- U.S. brand awareness, 2025: adidas and Nike tied at 94%, then Puma at 90%, according to Statista.
- Nike’s three names: Nike, Jordan Brand and Converse total 33% of the 2022 estimate (18 + 11 + 4 = 33).
Which sneaker brands led the world in 2022?
Statista Market Insights estimated each brand’s share of the global sneaker market in 2022, and, per its chart, Nike came first at 18%. According to Statista’s chart of the world’s most popular sneaker brands, Jordan Brand followed at 11%, adidas took 9%, Skechers and Vans tied at 7%, Moonstar had 5%, and Converse and New Balance held 4% each. Hypebeast’s write-up of the chart gives the same figures.
| Rank (ties marked) | Brand | Estimated global market share, 2022 |
|---|---|---|
| 1 | Nike | 18% |
| 2 | Jordan Brand | 11% |
| 3 | adidas | 9% |
| 4 (tied) | Skechers | 7% |
| 4 (tied) | Vans | 7% |
| 6 | Moonstar | 5% |
| 7 (tied) | Converse | 4% |
| 7 (tied) | New Balance | 4% |
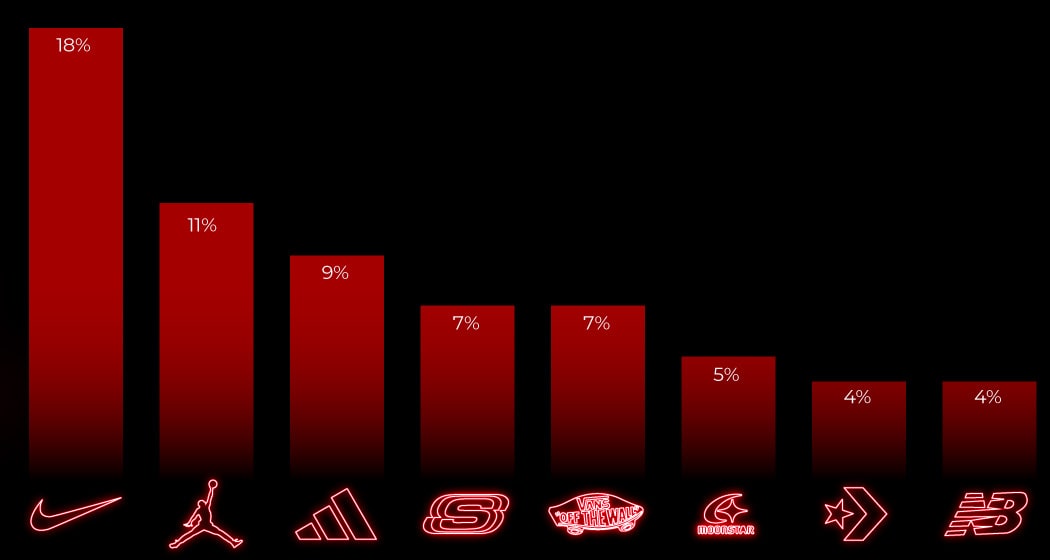
Nobody owns fourth place outright, because Skechers and Vans share it. Moonstar is the name most readers here will not know: the company’s own site says it has been making shoes since 1873 and produces them in Kurume, Japan. The eight shares total 65% (18 + 11 + 9 + 7 + 7 + 5 + 4 + 4), so the chart covers about two thirds of the estimated market.
What the 2022 ranking measures and leaves out
The 2022 ranking is an estimate of market share for sneakers, with purely functional athletic footwear taken out. In other words, the results here do not include performance sneakers, and what is left is the side of the market that falls right down our alley.
The chart’s footnote gives dedicated running, football or tennis shoes as examples of what is excluded, so a brand that sells mostly performance shoes looks smaller here than it would in a count of all footwear.
That is why we read it as a market estimate, not a vote. The chart describes shares of the market, not opinions, so it says nothing about hype, collabs or drops. The figures show how much of the market each brand was estimated to hold.
According to the same Statista article, the market was worth $75 billion in August 2023, with annual sales forecast to reach nearly $100 billion by 2028. Treat both numbers as figures from that 2023 article, not as a measure of the market in later years.
Is Nike really only 18% of the market?
Statista says Nike’s 18% understates the company, because Jordan Brand and Converse belong to it as well. This is the sentence from the text under its chart:
That figure underestimates Nike’s dominance in the game, however, as both the second-placed Jordan brand and Converse in seventh place are also owned by the Beaverton, Oregon-based sportswear giant.
Add the three shares and the picture changes: 18 + 11 + 4 = 33%, so one company accounted for a third of the 2022 estimate, against 9% for adidas, the largest brand on the chart that Nike does not own. As of 6 October 2026, Statista’s page still describes both Jordan Brand and Converse as Nike-owned.
Our posts on Nike’s sub-brands, the history of Nike and Jordan Brand’s 40th anniversary go deeper on each name.
Which sneaker brands do U.S. owners like most?
The 2025 U.S. ranking is a survey of how many sneaker owners like each brand. Statista Consumer Insights asked 1,230 U.S. respondents aged 18 to 64, all of whom knew the brands, in April and May 2025. The chart reports Nike at 62%, followed by New Balance at 45%, adidas at 42%, Skechers at 40% and Jordan Brand at 39%.
The chart also reports Puma and Vans at 33% each and Reebok at 32%. The chart draws a second bar for owning at least one pair, but it prints no figure on it, so we leave those numbers out. Statista also adds a caveat of its own: Jordan Brand “is likely higher up the list among die-hard sneakerheads”.
For our own picks rather than survey results, see our rundown of the best sneaker brands.
How well-known is each sneaker brand in the U.S.?
Brand awareness is the share of people who recognise a brand when shown its logo and name, and it says nothing about liking or buying. Statista’s 2025 awareness ranking asked 1,249 online respondents aged 18 to 64, between 24 April and 14 May 2025, whether they know each brand, even if only by name. The table reports adidas and Nike tied at the top with 94%, followed by Puma at 90%, Reebok at 89% and Jordan at 87%.
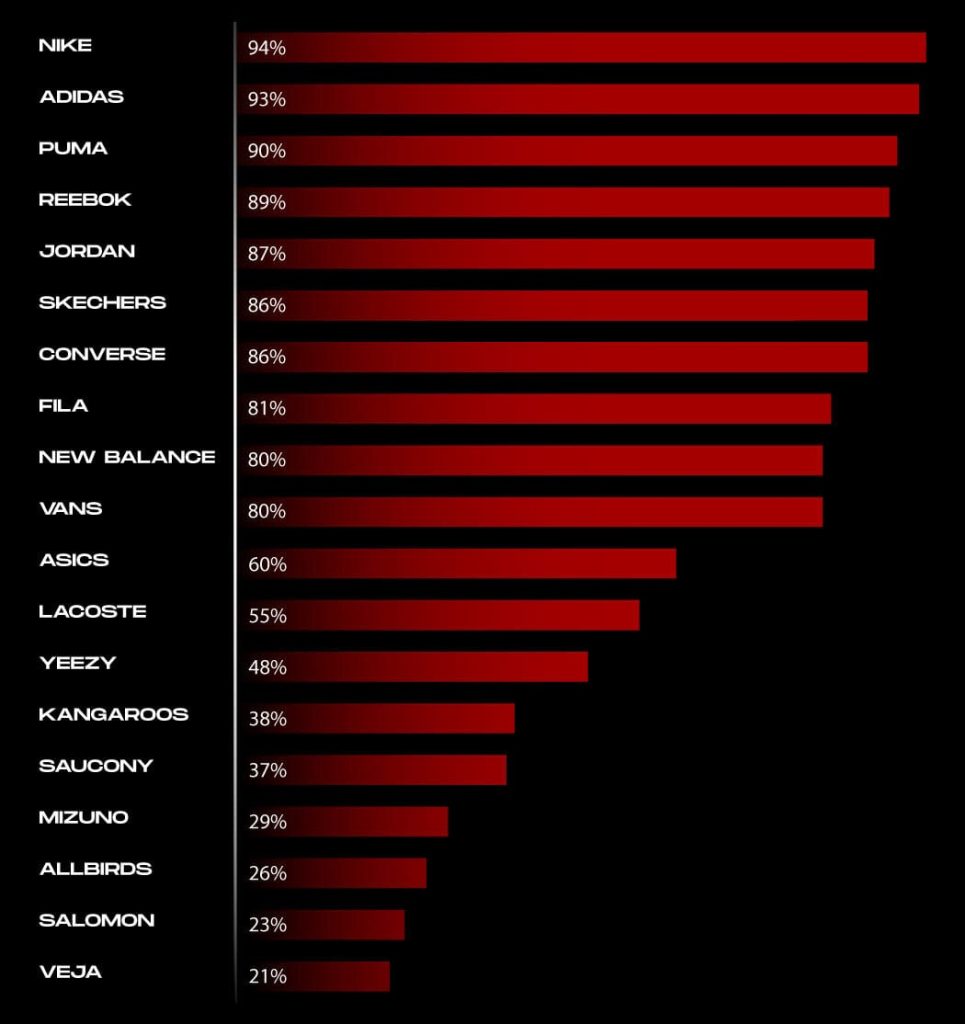
The same table reports New Balance and Skechers at 85% each and Vans at 81%. Among the eight brands that appear in both 2025 charts, Puma ranks third for awareness but only tied for sixth on liking, and Reebok ranks fourth for awareness but last on liking. Being recognised and being liked are different things, and the data does not show who is buying.
Why the three rankings disagree
The three rankings disagree because each one counts something different: share of the market, liking among owners, or recognition. They also differ in place and time, since the 2022 estimate is global and the two 2025 surveys cover only the U.S., so the gaps between them are not a trend and we do not read them as one.
| Brand | Global market share, 2022 (estimate) | U.S. owners who like it, 2025 (1,230 respondents) | U.S. awareness, 2025 (1,249 respondents) |
|---|---|---|---|
| Nike | 18% | 62% | 94% |
| Jordan Brand | 11% | 39% | 87% |
| adidas | 9% | 42% | 94% |
| Skechers | 7% | 40% | 85% |
| Vans | 7% | 33% | 81% |
| Moonstar | 5% | not listed | not listed |
| Converse | 4% | not listed | not listed |
| New Balance | 4% | 45% | 85% |
| Puma | not on chart | 33% | 90% |
| Reebok | not on chart | 32% | 89% |
Nike is first, or tied first, in all three columns. Jordan Brand is second on 2022 share but fifth on U.S. liking. According to the figures above, New Balance held 4% of the 2022 estimate yet was liked by 45% of U.S. owners in 2025, the second-highest figure, because the two numbers answer different questions.
Moonstar and Converse are not in either 2025 U.S. list, and Puma and Reebok are not on the 2022 chart, so those cells are marked rather than guessed.
What has changed for adidas and Skechers since 2022?
Two brands from the 2022 chart have since had company-level changes that sit outside any popularity ranking. On 25 October 2022, adidas announced in a press release that it was ending its partnership with Ye, would end production of Yeezy branded products and would “stop the adidas Yeezy business with immediate effect”. It added that the move was expected to cost up to €250 million on its 2022 bottom line.
We wrote up the split in our post on adidas ending the Yeezy partnership.
Skechers changed owners instead. In its release of 12 September 2025, Skechers said 3G Capital, a private partnership, had completed its acquisition and that its shares would no longer trade on the NYSE. The same release calls Skechers the third largest footwear company in the world, which is the company’s own claim and not one of the Statista figures above. Neither Statista chart says how either event moved a ranking, so we do not draw that line.